Access Assurance Dashboard
In 2020, when the world was shaken up by the emergence of a pandemic, more companies had to quickly adapt to remote and hybrid work environments. As an enterprise solution provider that enables employees to work from anywhere, our objective was to help companies gain better visibility into their remote workers activities.
Role
Product Designer
Collaborated w/ 1 Product Manager, 1 Content Designer, 2 Engineers.
Time frame
Mar 2021 - Sep 2023 (2 phases during time frame)
Platform
Web (Desktop)
Problem context
With employees accessing company resources remotely from different locations and devices, it introduced new challenges for the company’s overall security and impacted the IT and security teams (SecOps) who assess risk and monitor threats.
SecOps teams typically review log files to get access data which can be time consuming. So, our customer (IT admins and SecOps) needed help to understand where employees were accessing from, what applications they were using, from what devices and network in order to mitigate security threats.
Goals
Our customer (IT admins and SecOps) need to understand where and how employees are accessing company resources and if any anomalous behavior is detected, SecOps need to be informed and have the ability to protect the users and the organization from potential compromises.
For the customer:
Visibility of user access and activity
Ability into drill down and investigate
Ability to set parameters of what is anomalous
Ability to set actions on anomalous behavior detected
For the business:
Increase active use and product value of CAS/S
Positive impact to customer license renewal + activation
Design process
I reviewed the existing probes feature, research findings and some competitive analysis to get the current lay of the land and see where we stood against competitors. This also helped identify feature gaps and potential feature enhancements. I worked with the product manager to better understand what an admin needs to do their job in identifying failures, troubleshooting and triaging.

The scope was constantly changing and I had to work with some unknowns. After many discussions with my product counterparts, we got to a place where we had solidified what aspects we planned to include in the 1st iteration of the assurance dashboard — focusing on access assurance. I developed low-fidelity concept mock ups to help aid conversations with the team. From there, we narrowed down our scope mainly based on engineerings bandwidth, time and what data was available to use.

With the many complexities of assurance dashboard, I'd like to dive into two specific features:
Map visualization — where I fine tuned the visual and interaction design
Geofencing — where I seamlessly connected the map visualization, geofence, risk indicator and policy into the user flow
Map visualization
The map visualization is an effective way to show trends and insights associated with geographical locations. For access assurance, I needed to consider 3 dimensions:
Locations of access
No. of users accessing from location
Geofenced locations (safe or risky)
After researching various map visualizations, I chose the geographic bubble map to clearly show the magnitude of the data value where locations with large number of access reflect a large bubble. I explored options to define the bubble map details such as: map frame width, bubble opacity, bubble border stroke, bubble min and max size, etc.
The width of the map frame went through various explorations. Citrix Analytics is a data heavy product filled with summary metrics, tables and lots of text and numbers. So, I was inclined to make the map a prominent piece of the dashboard and went full width initially. I weighed out the pros and cons for a few options. I chose option D because it allowed for both a moderately sized map for interactivity and space for a table which complements the map's data.

The bubble attributes (opacity, border, etc) required a bit of fine-tuning. Since the bubbles overlay the map, it was crucial to test varying levels of opacity. I chose a 50% opacity with a solid border stroke of 1.5px after some explorations. A medium opacity allowed for more defined bubble plots without losing the country borders. The more transparent the bubbles were, the bubbles and lines were blurred and washed out and lost readability.

After designs have been delivered, it's important to me to remain involved during the implementation process. As I was reviewing the map visualization, I noticed the map color was not in line with that I had provided in my designs. The engineer had used the color noted, but it did not translate the same. So, I worked closely with the engineer, got access to Mapbox to quickly troubleshoot and ensure the location labels were legible and ensured I called out all the changes clearly for the engineers.

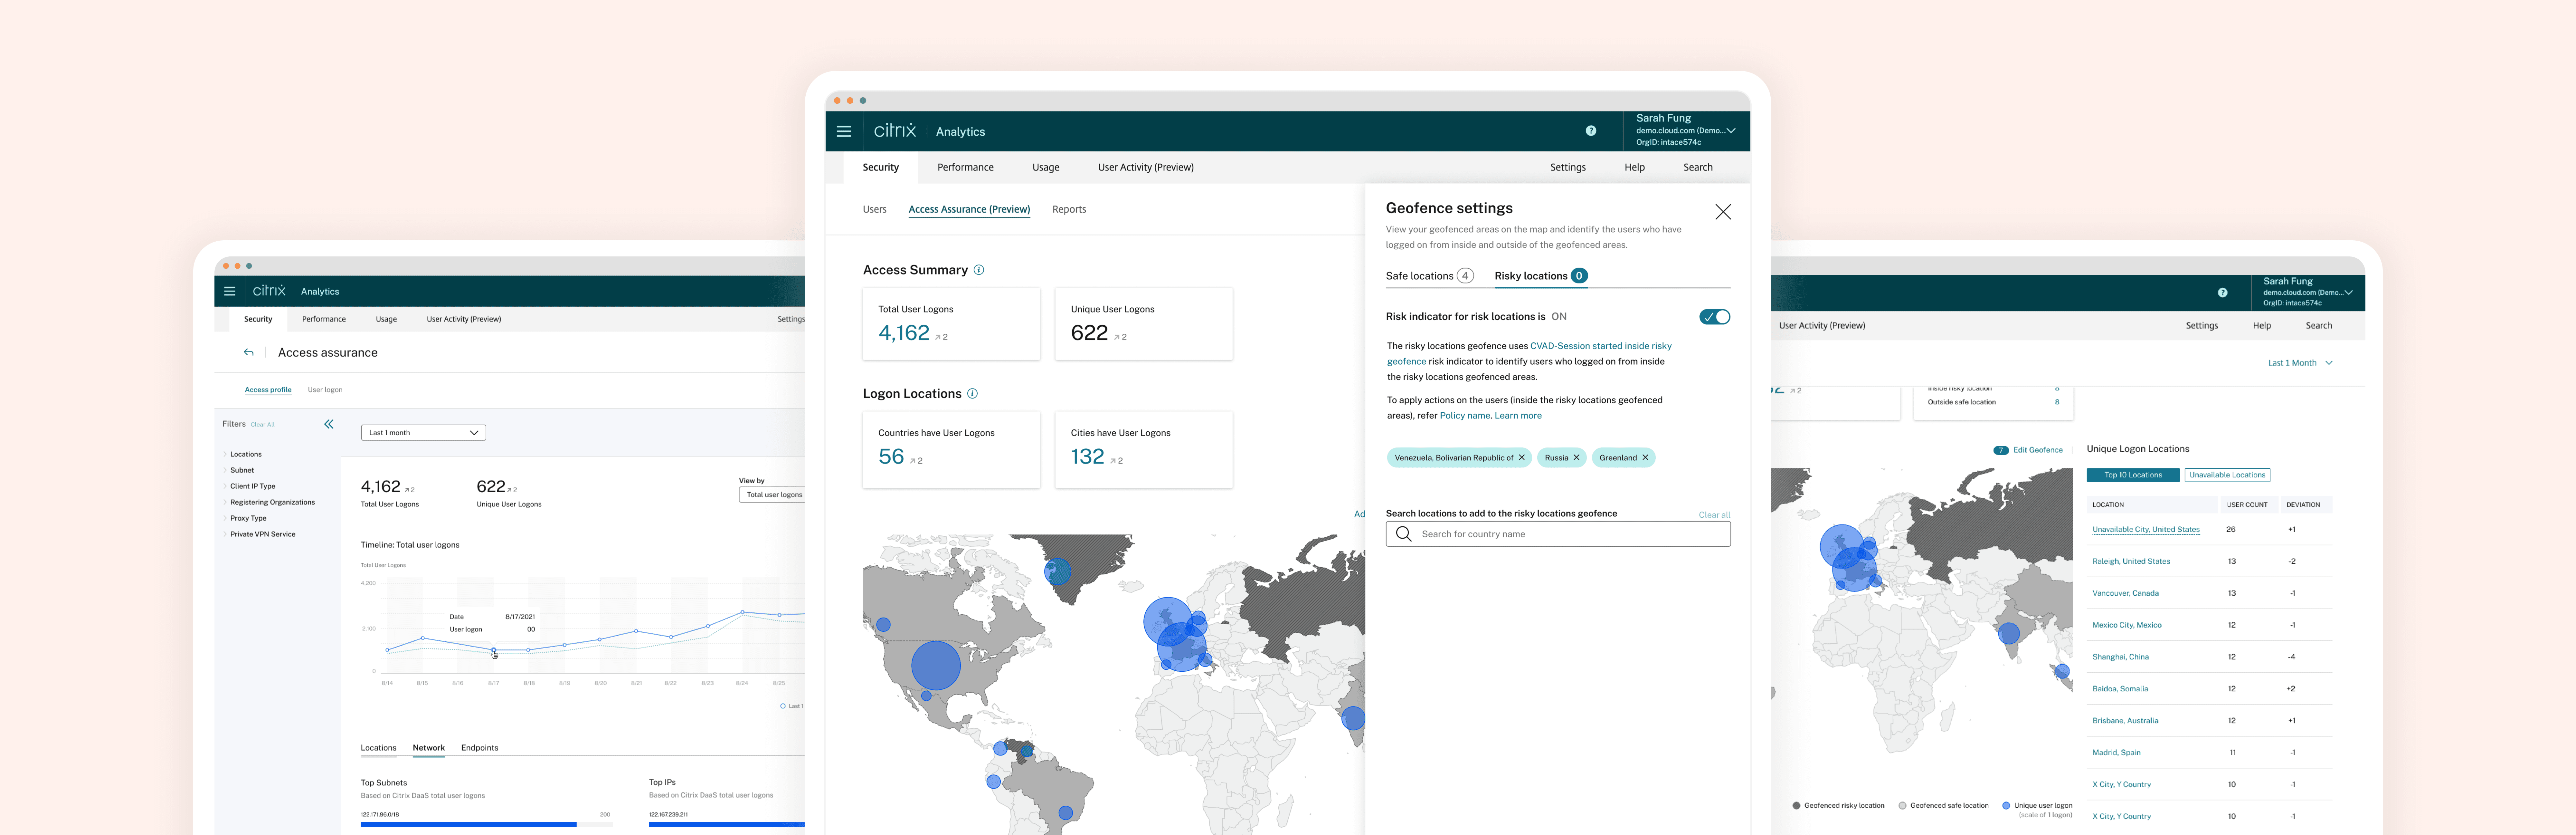
Geofencing
Geofencing is a key component to the access assurance dashboard. It allows customers to define what locations are considered safe versus risky in their organization. With this user input, we correlate it to the geofence risk indicator and inform the user to create a policy to apply any actions to safeguard their users and resources.
A risk indicator is user activity that is potentially risky to your organization. A policy is an action that has been set to take place when a specific risk indicator has been triggered. For example: An admin set up a risk indicator and policy to alert the admin, any time a user accesses CVAD from outside the U.S. because your company only operates within this geographic location. If someone from Australia tries to access CVAD, then the risk indicator and policy will trigger because there was an access attempt outside the U.S.
Based on all the requirements, I developed a user flow which helped shape up the geofence configuration blade design to ability to:
Add or edit a geofence
Connect the geofence to the risk indicator
Connect the geofence to the policy
View the visualization reflected on the map (access locations + geofence)
After many explorations for the geofence blade, I had 2 options that I was weighing. One option was a ‘single view’ approach where the user would choose a location from a searchable select dropdown and view the selections as chips -- all in a single view in a blade. The second option was a guided ‘multi-view’ approach where the user would enter an “edit” mode to choose locations from a searchable select dropdown. After the selections are made, then enter a “view” mode of all confirmed selections.

After reviewing with the design team, an internal usability test, getting input from engineering and weighing out the pros and cons of both options, I chose option A (single view). This geofence blade approach offered a simple user flow without having to toggle between a view and edit mode. This also helped with the time constraint engineering had working against them. With this, I delivered the 1st iteration of access assurance with geofencing.

Reflection
Access assurance was a rewarding feature to work on. I enjoyed working on the map visualization as it was uncharted territory and a good learning experience. But, this feature came with some challenges as well.
Challenges
This feature was particularly complex because the scope was changing day to day. I had to check-in with the product manager every night (cross geo-locations) to ensure we were on the same page and adjust to the product manager's working style. This feature endured many design iterations throughout its initial phases. Riding out this wave instilled more confidence in questioning the product team's decisions and pushing back when necessary.
Citrix Analytics has a lot of UX and technical debt and in the process of transitioning from old to current design systems. This created some speed bumps and highlighted the importance of the design team working closely with engineering to establish a solid process and create efficiencies (ie. UI libraries, token, etc.).
Results
Preliminary qualitative feedback proved this feature was receiving positive marks. The product managers had regular meetings with customers and shared there was excitement around this feature and access assurance was slated to become the new landing page for Citrix Analytics for Security.
Since this feature was a new offering to Citrix Analytics for Security, it would've been great to learn from the performance data. However, I was unable to see this through due to my abrupt departure from the company. I would've liked to:
Understand the adoption and usage data of the dashboard and geofencing
Understand how this feature affected active use of the overall Citrix Analytics product
Feedback on the visual and interaction of the map visualization

